
What can you see? The Hermann grid is a characteristic of simultaneous contrast, which was already described in 1870 by Ludimar Hermann (1838-1914). Later it was taken up again by Ewald Hering (1834-1918) and its representation can be found in most of the textbooks of physiology, now under the name Hermann-Hering Grid.
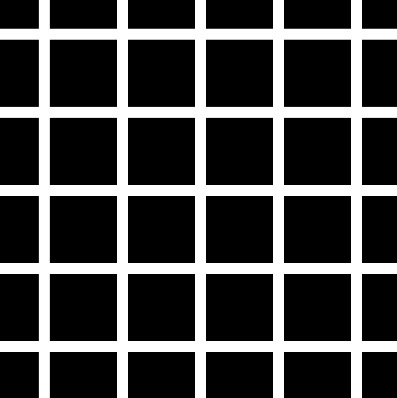
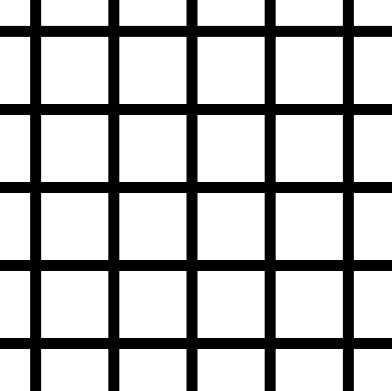
In the black grid, the crossing points of the white lines appear darker than the straight line parts. However, this does not apply to the intersection that you are currently fixing, but only in the peripheral field of view. In a negative presentation, this impression is reversed and the intersections appear lightened.
The Hermann grid has been interpreted for almost 5 decades as a sign of the so-called lateral inhibition on the retina. Variants of the grid, however, point to the involvement of the visual center in the brain.
What can you do? In this project the HSV model is used as a basis. Accordingly, you can specify the three values for the squares (sq_hue, sq_saturation, sq_brightness) and the gaps (gap_hue, gap_saturation, gap_brightness) separately. The squares can be enlarged or reduced with sq_size. The breadth of the gaps are determined with gap. So you can reproduce the images above. In particular, you can investigate at which distance of the squares the effect is still noticeable. Does the color and the strength of the contrast of squares and gaps have any influence?
There is more to see: Meanwhile, there are some variants of the grid. It turns out that even small curvatures (here: angular deviations) in the intermediate lines (figure left) make the effect disappear (Geier et al., 2008, Levine & McAnany, 2008; they substituted sinusoid curves for the straight lines). If the curvatures cause the squares to become rhombic, diffuse dark bands appear to cross the black rhombi along their short axes (Motokawa, 1950). The clarity of these bands depends on the cutting angle (figure right). These variants show that the previous interpretation of the deception was at least incomplete.
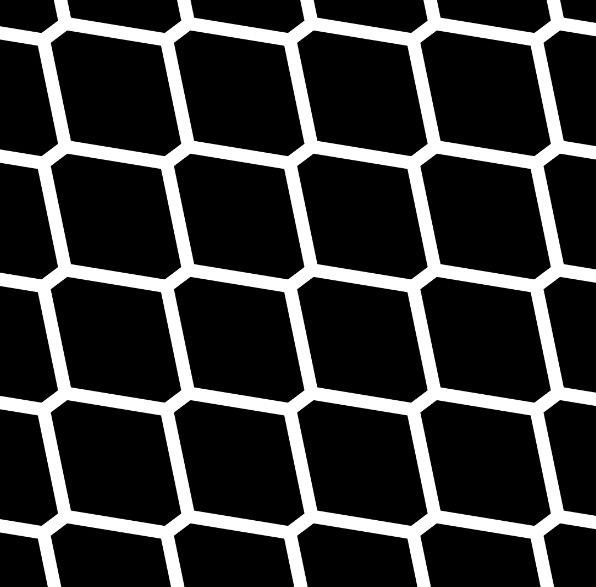
What can you do? In addition to sq_size and gap, here for the crossing corners deviations in the x-direction (x_delta) and y-direction (y_delta) can be defined. So you can test how sensitive the effect is to small deviations. For better clarity, the color values are hidden. You can reactivate them in the program if necessary.
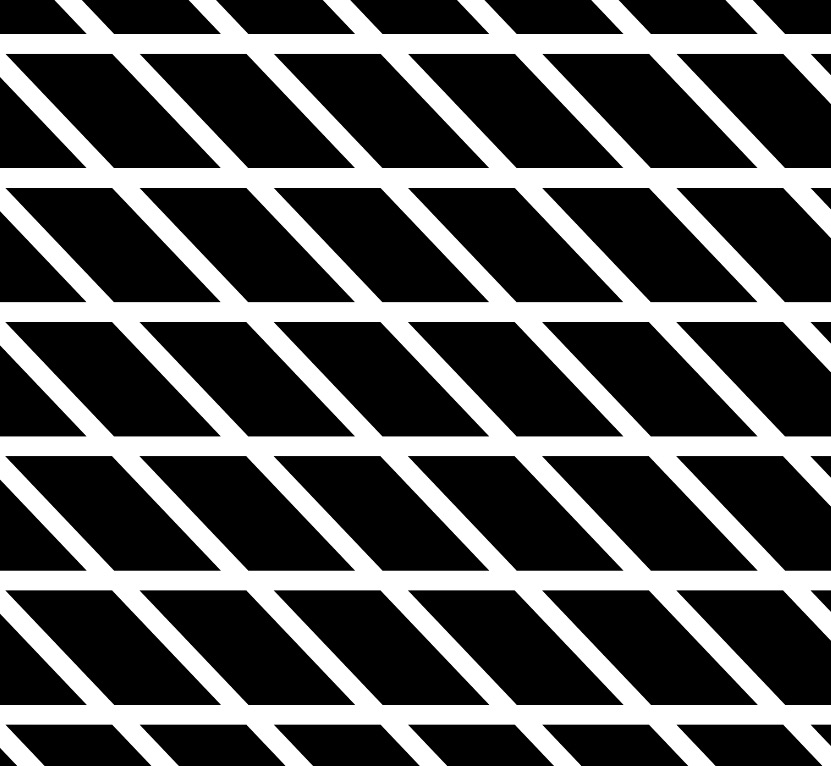
Geier et al. (2008) have experimented with five other forms of deviation (wave, knot, hump, half-sided hump, asymmetrical hump). With small changes in the program you can also easily reproduce these.
Related topics: Ehrenstein illusion, Scintillations
References:
Geier, J., Bernáth, L., Hudak, M. & Sera, L.(2008). Straightness as the main factor of the Hermann grid illusion. Perception 37(5):651-65. Available as download.
Levine, M. W. & McAnany, J.L. (2008). The effects of curvature on the grid illusions. Perception 37, 2, 171-184. Available as download.
Motokawa, K. (1950). Field of retinal induction and optical illusion. Journal of Neurophysiology 18, 413-426.